IMPACT
Climate change
Impacts on biodiversity
What is climate change and why is it important? James Pearce-Higgins, Director of Science at the British Trust for Ornithology, considers how climate impacts the distribution of biomes and species, and explains how changes in climate may put some species at risk of extinction
The term ‘climate’ refers to the totality of weather and atmospheric conditions at a location. Climate change refers to long-term changes in these conditions, including the changes in global temperature that have been recorded since 1850. In the decade from 2011–2020, global surface temperature was 1.1°C warmer than the 1850–1900 average. Most of this increase has been attributed to human-driven increases in concentrations of greenhouse gases.
Climate change is shifting weather patterns throughout the world. Higher temperatures lead to more rainfall because warmer air contains more moisture. The increased energy in the atmosphere causes more severe storms and flooding, and increased frequency and severity of heatwaves, droughts and wildfires. In cold environments, higher temperatures cause melting of snow and ice, leading to changes such as the retreat of glaciers.
The volume of the sea expands with temperature. Sea levels rose by 20 cm between 1901 and 2018, affecting coastal habitats.
Drivers of distribution
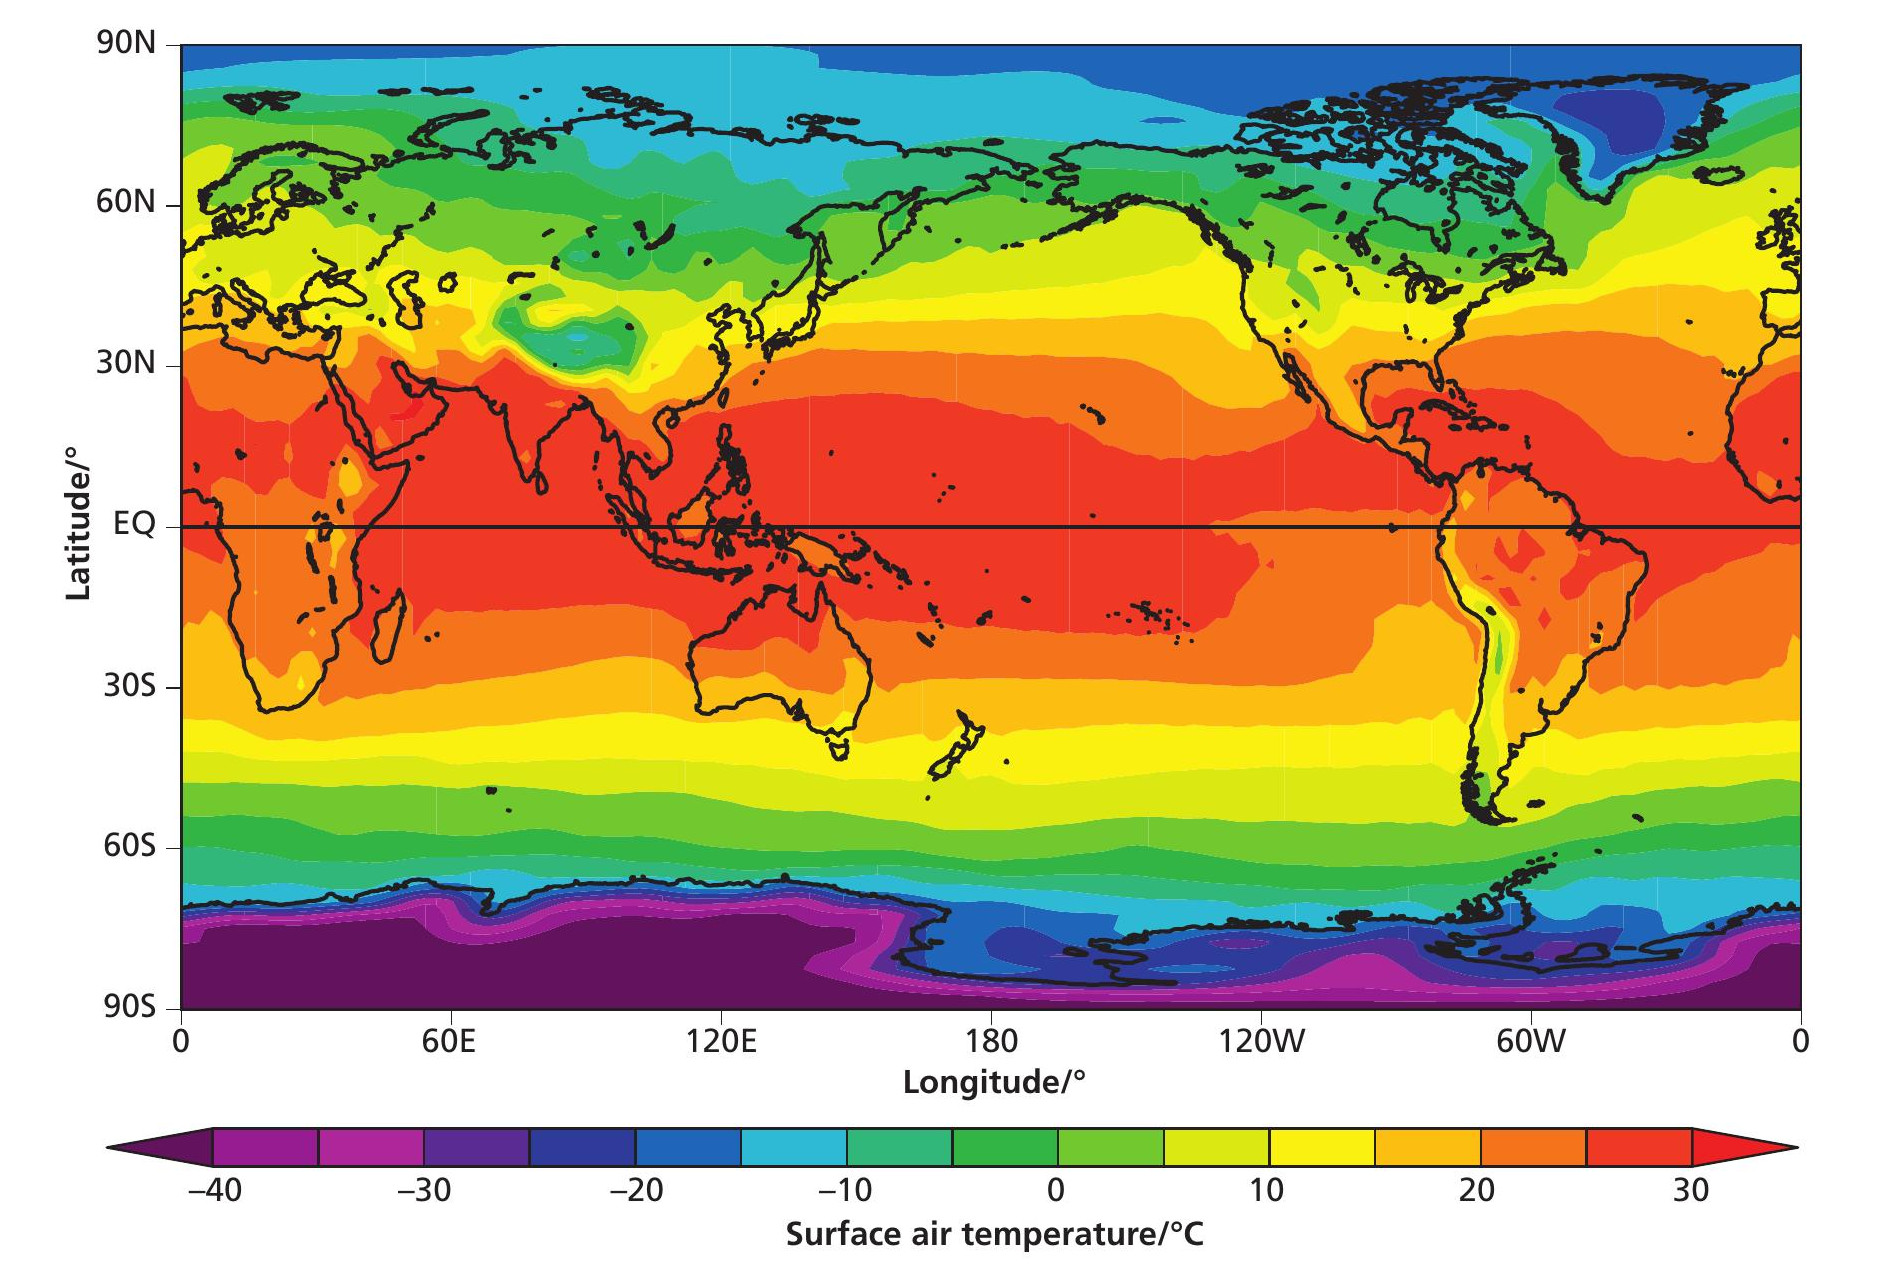
A biome is defined as a geographical area that contains a distinct community of organisms (such as a tropical rainforest or desert). The distribution of biomes globally is determined through a combination of climate and geography. Temperature is greatest in the tropics (the zone between the Tropics of Cancer and Capricorn), where solar radiation is at its strongest, and lowest at the poles (see Figure 1).
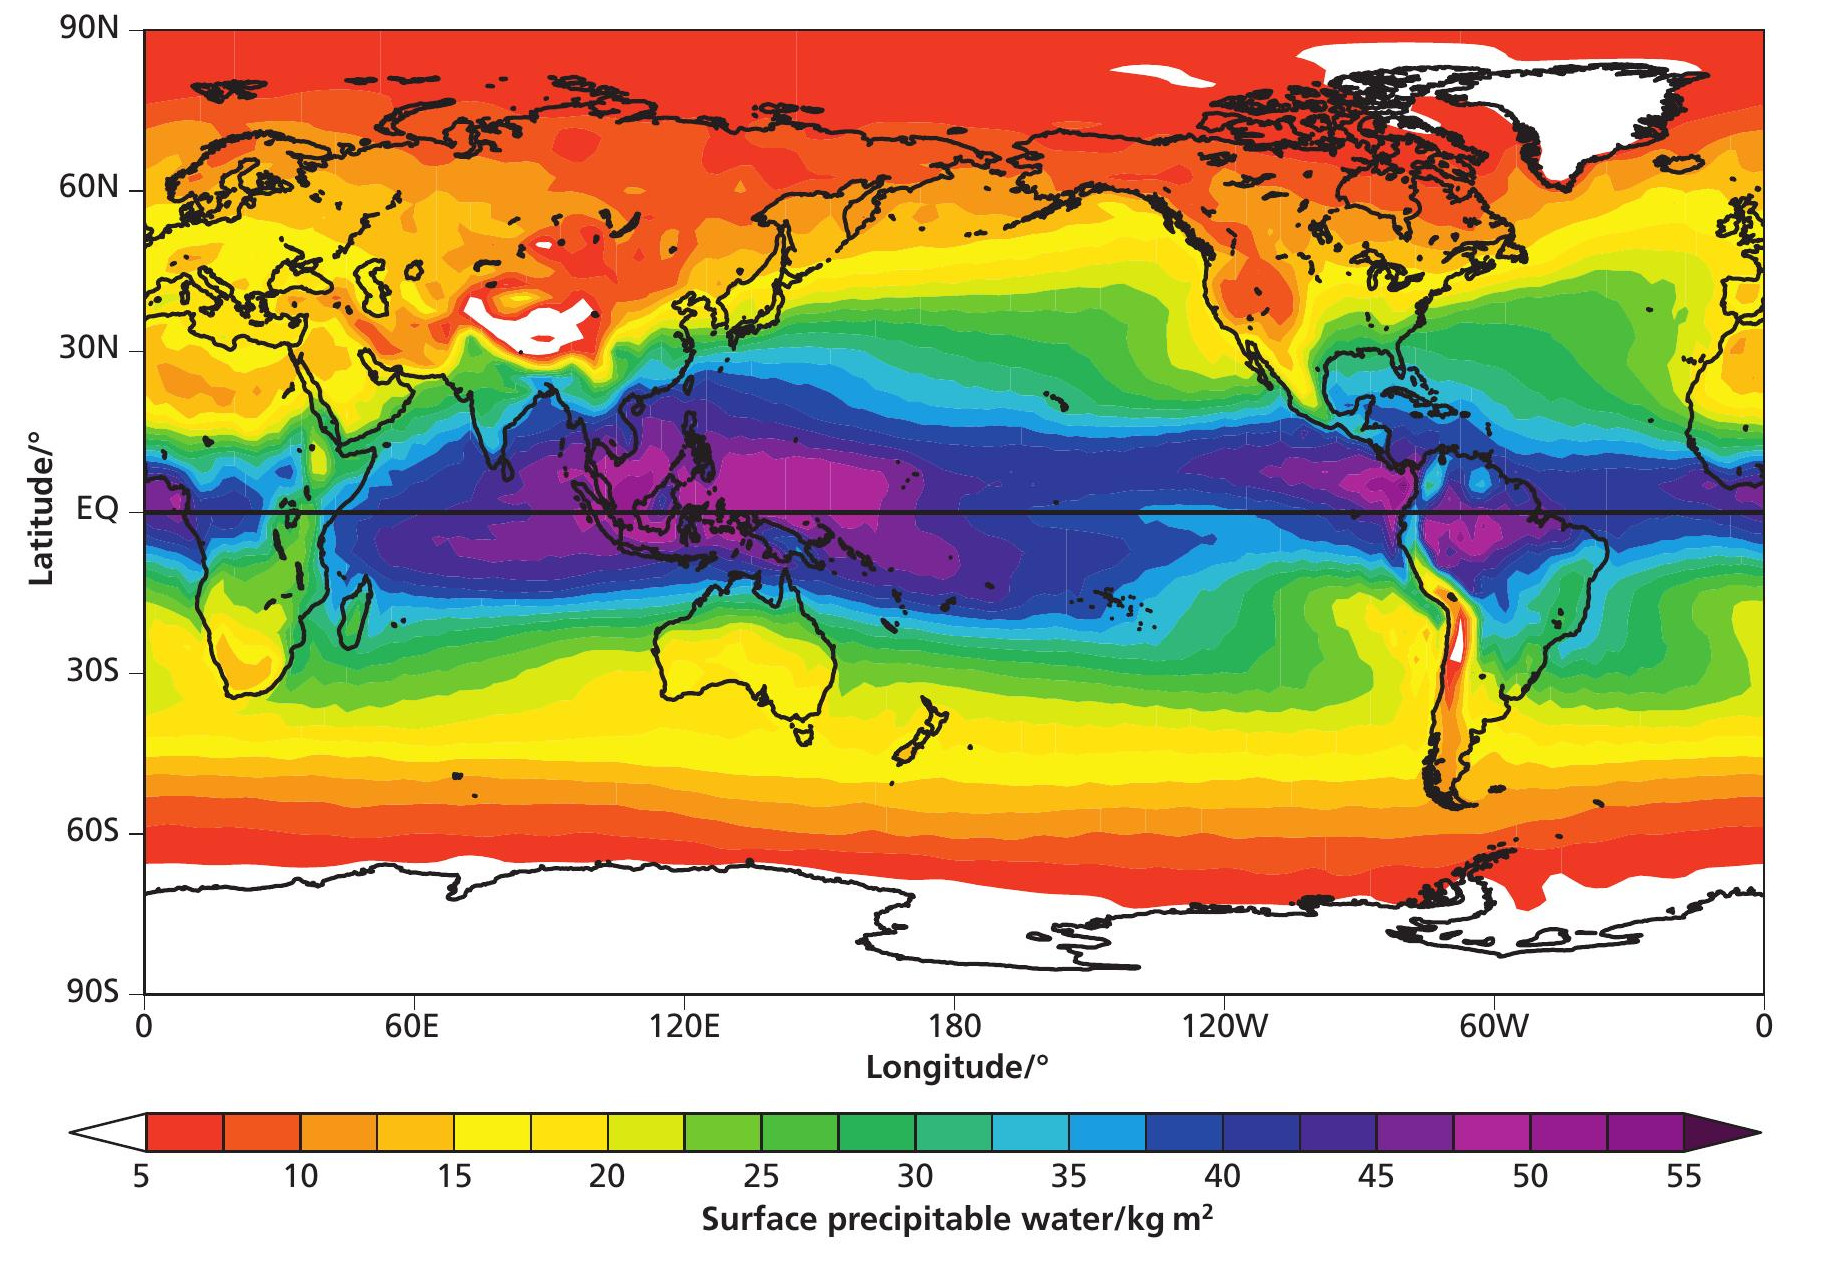
Precipitation depends on a number of factors, including oceanicity, topography, temperature and wind direction. Areas of high rainfall are generally associated with maritime climates, where warm moist air from the sea hits the land. Continental climates away from the sea tend to be drier, except where other factors come into play (see Figure 2).
The combination of temperature and rainfall is a major driver of the distribution of vegetation types. Low temperatures limit vegetation growth, leading to the tundra and boreal coniferous forests that span the northern hemisphere.
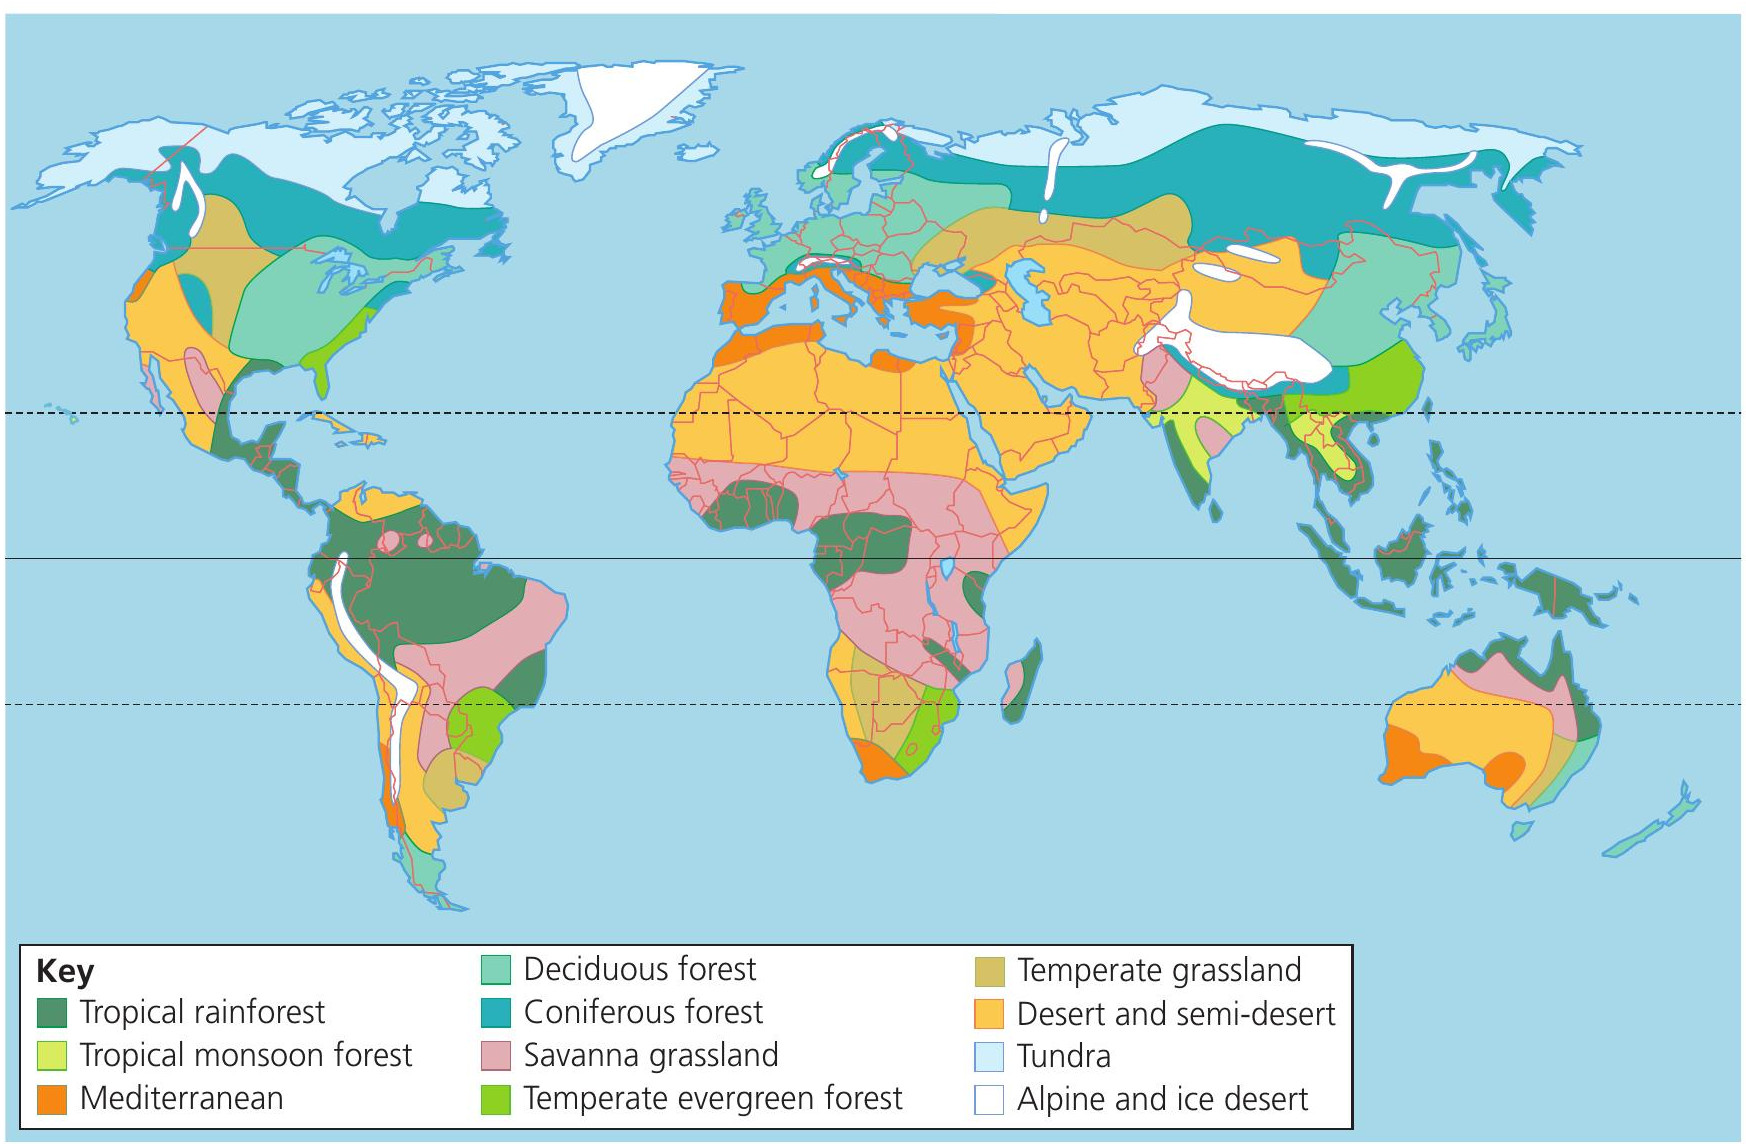
In warmer climates, precipitation determines whether environments are dominated by forest, grassland or, in the driest areas, Mediterranean or desert environments. The global distribution of biomes is shown in Figure 3.
The same factors influence global patterns of species richness. Plant diversity is greatest in the humid tropics of the Amazon, West Africa and Indonesia, and the tropical mountains of the Andes, Central America and Himalayas. Bird diversity is similarly maximised by climatic drivers of plant diversity and growth.
Climate change
If climate is a key determinant of biomes and species distribution, then we would expect climate change to cause changes in this distribution. There is widespread evidence that climate change has influenced survival rates and breeding success in plant and animal populations around the world. At mid-to-high latitudes – that is, towards the poles – where temperature tends to be limiting, warming drives many of these responses. In tropical regions, it is usually changes in precipitation that underly climate change-driven changes in populations.
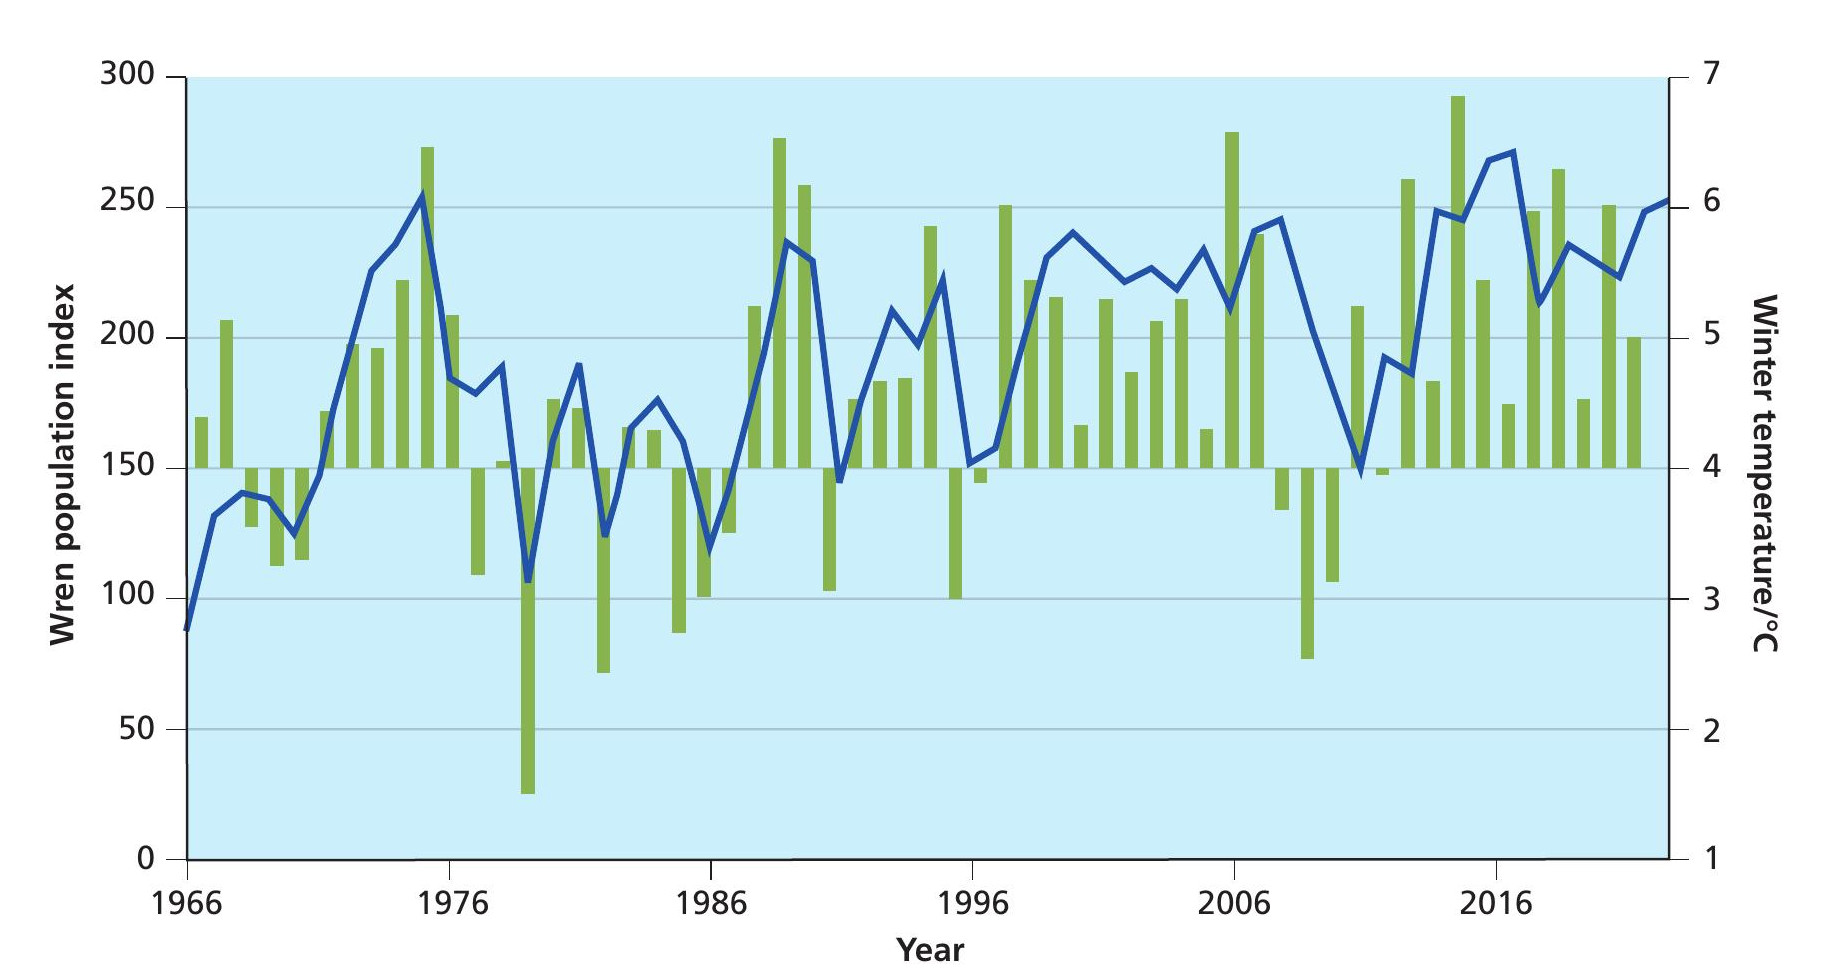
Some changes can be beneficial. At higher latitudes, warmer temperatures reduce the risk of cold-related mortality that limits the abundance of many species. For example, UK resident bird species such as wrens and goldcrests have increased in abundance as winters have become milder (see Figure 4).
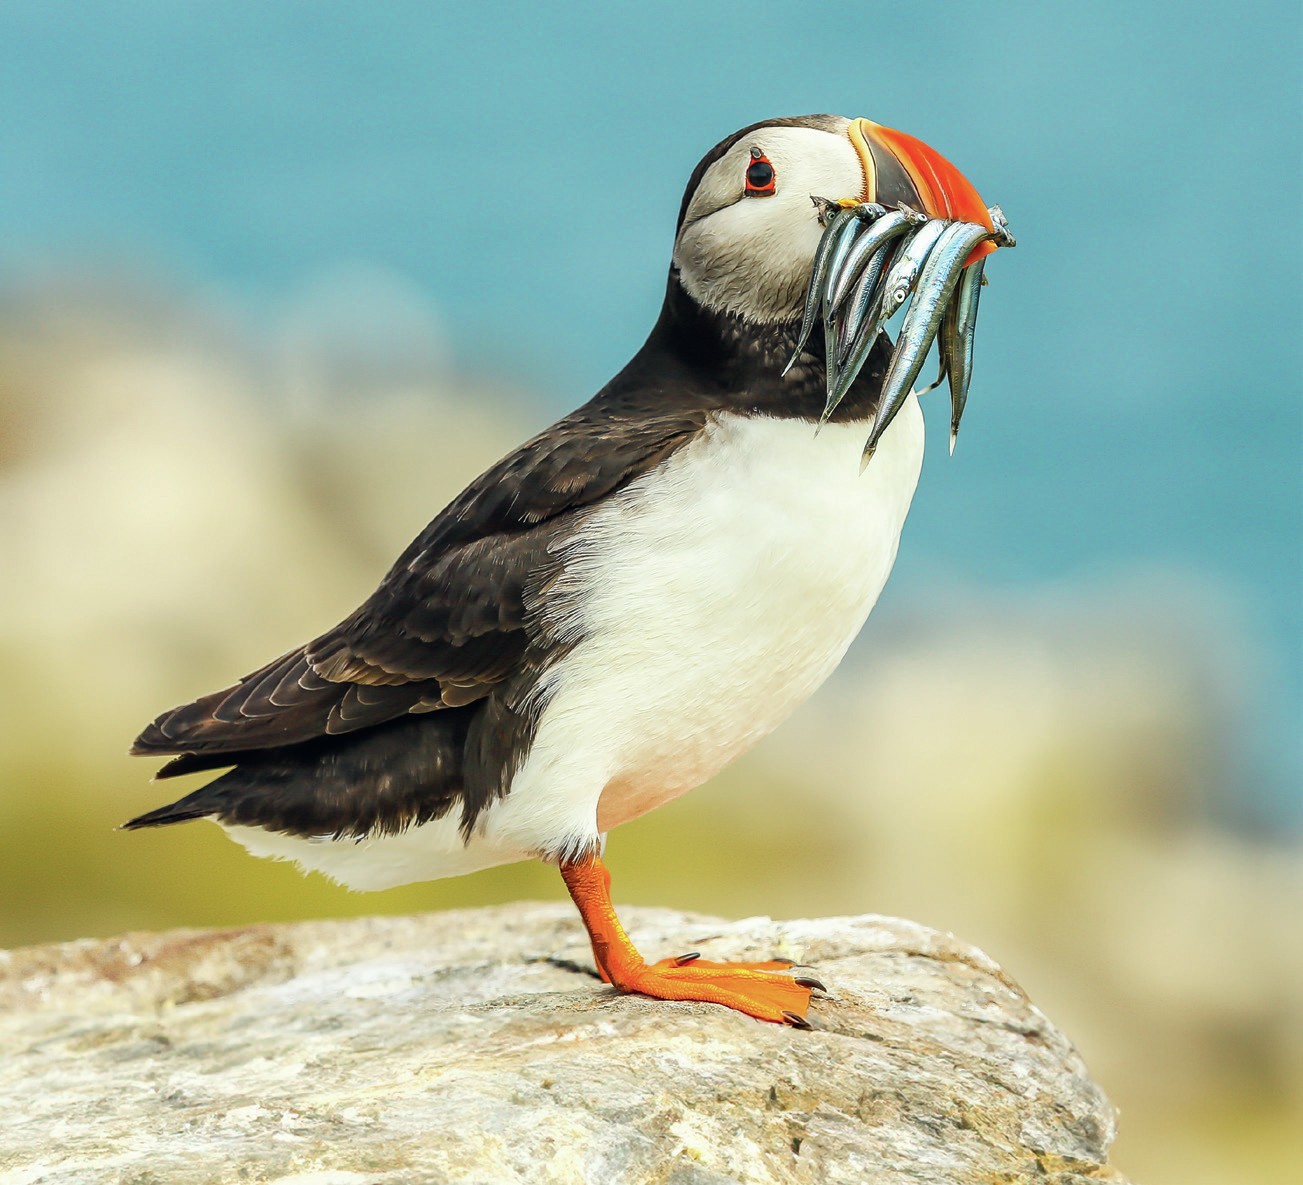
For other species, climate change impacts are negative. Many of these negative impacts are caused by ecological disruptions between species, as the abundances of predators, prey and pathogens change. For example, warmer seas are associated with smaller populations of fish, such as sand eels, which are important prey for breeding seabirds, such as puffins, kittiwakes and Arctic terns.
Rising temperatures have also been associated with reductions in body size in a range of species. One explanation for this is a reduction in cold-driven stress, which penalises individuals with a high surface area-to-volume ratio. However, this size trend is also seen in tropical songbirds, suggesting that it may be caused by reduced environmental quality and resource availability.
One of the most widespread, observable signs of climate change is altered timing of biological events. Warmer springs in temperate latitudes have caused earlier flowering of plants, emergence of insects, and migration and egg-laying in birds.
Rates of change differ between trophic levels: plants (primary producers) show the strongest response to temperature, followed by herbivorous insects such as caterpillars (primary consumers) and then insectivorous birds (secondary consumers). A mismatch in timing between peak availability of prey and the needs of their predators may in the future lead to population-level impacts on species.
Shifting distributions
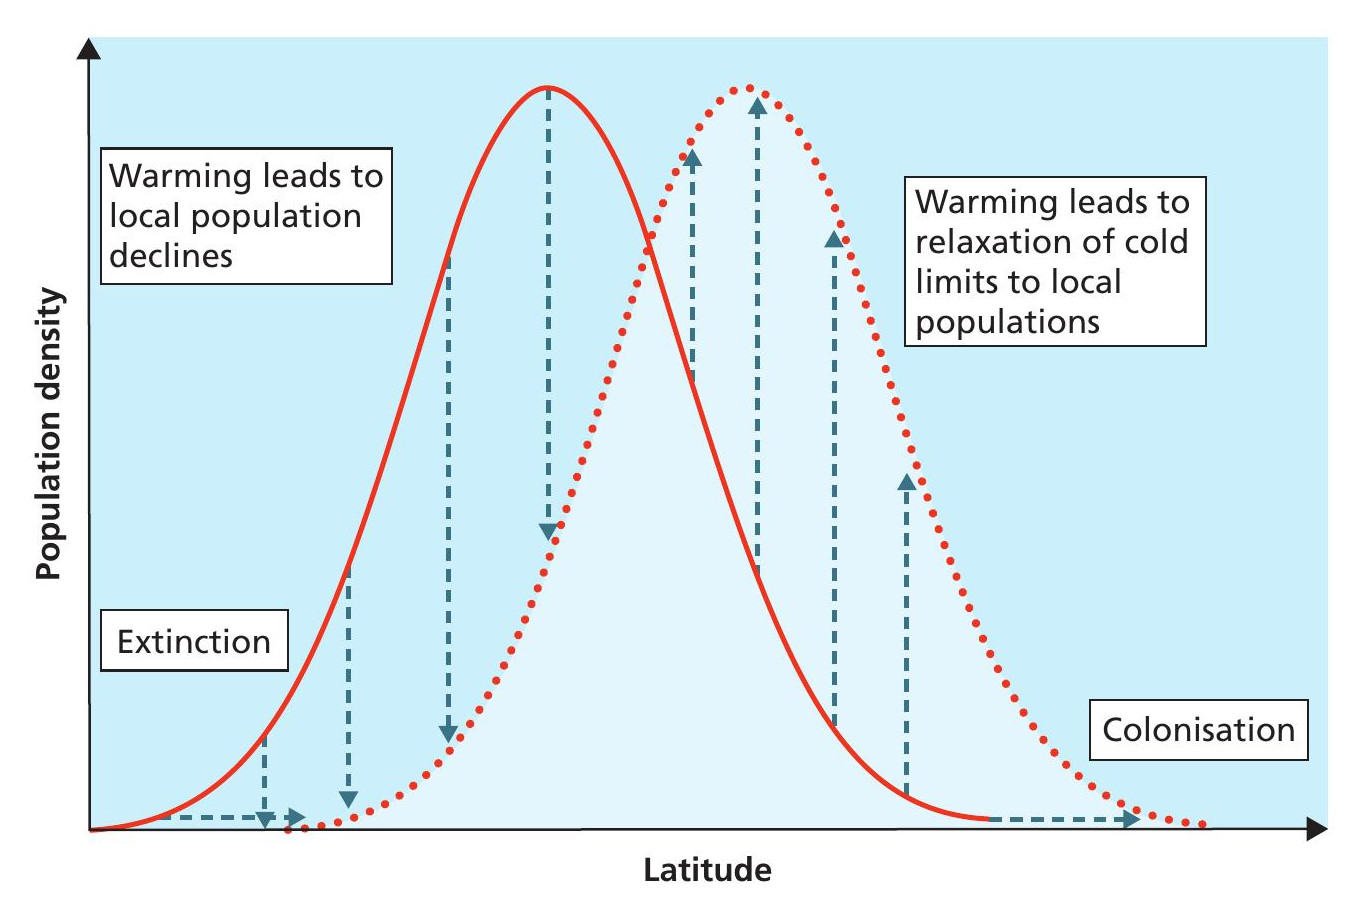
Many species have shown shifts in their distribution in recent decades. For example, climate warming relaxes the limiting effect of cold at the poleward range margin of species, increasing survival and/or breeding success. The resulting population increase provides individuals that can disperse to colonise newly suitable sites as they warm. This leads to a poleward shift in the species’ range margin.
Conversely, at the trailing range margin, where increasingly warm temperatures are more likely to be limiting, survival rates and/or breeding success may decline, such as due to a reduction in food resources. This will cause reduced abundance, and potentially localised extinction and range contraction of the species (see Figure 5).
Globally, poleward shifts in species distribution averaged 17 km per decade from the 1960s to the 2000s, but some species have moved much more than this. For example, the nuthatch has shifted its distribution from northern England to the central belt of Scotland and beyond, at a rate of about 10 km per year since the 1990s. The range limit of the small skipper butterfly has shifted northward from Yorkshire to the Scottish border in 4 decades.
The cumulative impact of all these changes alters ecological communities through time. Warm-associated species, with more southerly distributions, are becoming more common relative to cold-associated species. Habitat generalists are also proving more adaptable and increasing more than habitat specialists. Many new species have colonised the UK in response to rising temperatures, including insects, such as the willow emerald damselfly, and birds, such as the great white egret. Plants are also showing the same shifts – treelines are expanding poleward and upward, largely due to warmer temperatures.
Likely impacts of future climate change
The extinction of only a small number of species has to date been directly attributed to climate change. One example is the Bramble Cay melomys, a small rodent found on a single low-lying island off Papua New Guinea, which appears to have been a victim of rising sea levels and storms. Despite this, conservationists fear that ongoing warming may threaten many more species with extinction. If we are already seeing widespread impacts of climate change with a 1.1°C warming, what about a warming of 2°C, 3°C or more?
To answer this, conservation biologists use a statistical model to predict the vulnerability of species to future change. This involves describing the distribution or abundance of a species as a function of a number of climatic variables, such as temperature and precipitation, in different seasons. The model is then used to identify areas of suitable climate now, and to predict how these are likely to change in the future. These changes in climate suitability, and the degree of overlap between current and projected future modelled distributions, can be used to assess the vulnerability of a given species (see Box 1).
Box 1 Modelling future climate vulnerability
We can predict the distribution of a species from key climate variables, such as winter cold, summer heat and precipitation or moisture. Climate projections under different scenarios describe how these variables will change in the future. These projections are used to predict how distributions of species could shift.
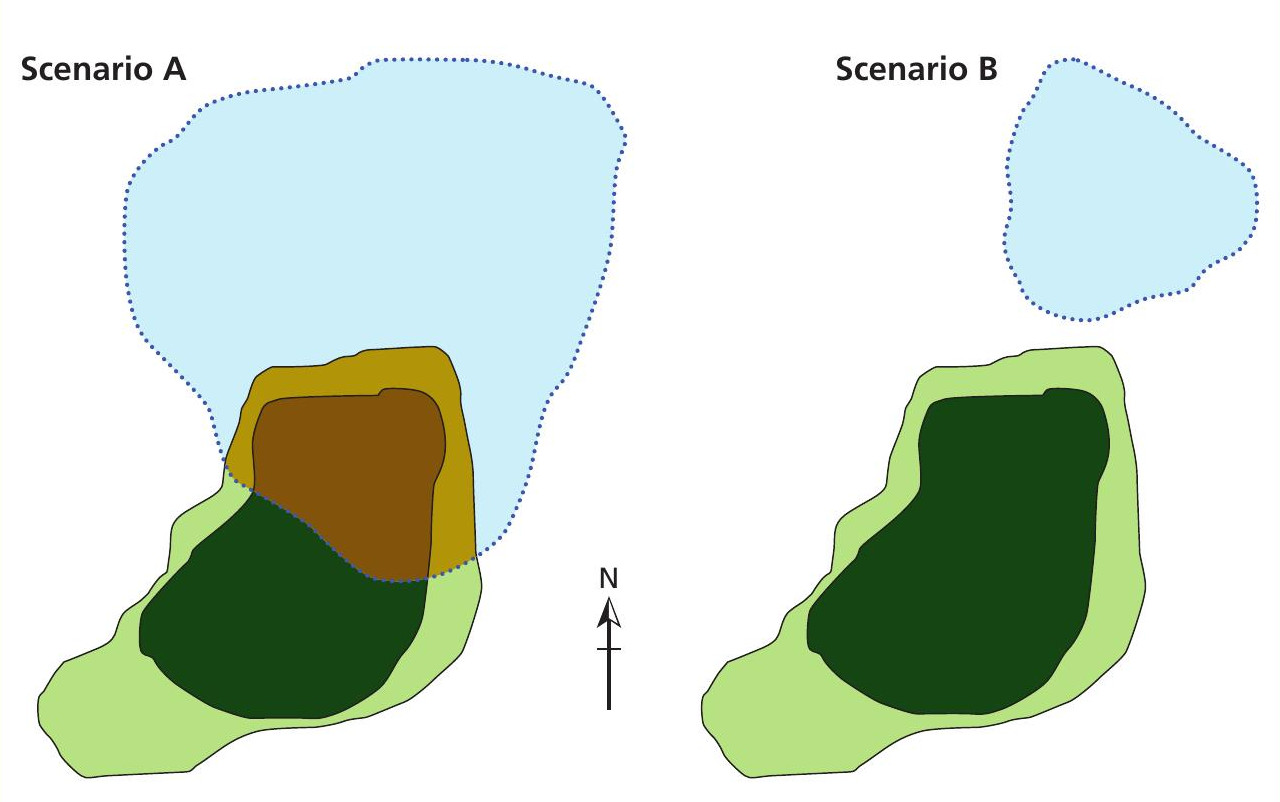
In the example in Figure 1.1 the spatial distribution of a species (dark green) is described by a statistical model based on climate suitability (pale green). The species distribution does not fill all of the potential area of climate suitability because of other factors – for example, lack of suitable habitat or human factors, such as hunting. Future climate suitability, predicted by applying the same statistical model to projections of future climate generated by climatologists, is described by the dotted blue area.
In Scenario A climate change is projected to result in an increase in the area of potentially suitable climate. However, if a species is unable to disperse to colonise unoccupied parts of the blue area, a decline in range extent is projected, making the species climate vulnerable.
In Scenario B the extent of future climate suitability is much less, leading to greater climate vulnerability. Given the lack of overlap between the current distribution (dark green) and projected future suitable climate (blue), if the species is unable to disperse, it is predicted to become extinct, unless conservation action can enable it to shift.
Many climate vulnerability assessments have been undertaken. Together, these predict that climate change will cause the extinction of about 8% of species across all warming scenarios and timeframes. Although an estimate like this is good for grabbing headlines, it is highly uncertain. Any extinction estimate is strongly dependent on the amount of future warming, and ranges from 5.2% species extinction at 2°C warming to 15.7% at over 4°C. It is also dependent on assumptions about how species respond to climate change.
When extinction is assumed to occur only if no areas of projected climate suitability for that species remain, then projected rates of extinction may be less than 1%. Alternatively, predicted rates of extinction are much greater for species that are unable to disperse or relocate. Conservation action can help species to reach suitable areas by protecting and restoring natural landscapes and ensuring networks of suitable sites for them to move through and colonise.
Despite the uncertainties in making predictions, modelling consistently highlights the importance of reducing greenhouse gas emissions to combat climate change. These uncertainties also highlight the value of long-term monitoring of the natural world and research aimed at understanding responses to climate change, in order to improve future predictions. There is plenty of work to do for any budding future conservation biologists reading this article.
Things to do
You can explore relationships and create your own graphs by downloading bird population trend data from the BTO Trends Explorer and temperature data from the Met Office (see ‘Resources’ box).
RESOURCES
Climate change and the UK’s birds: https://tinyurl.com/climate-change-UK-birds
The BTO Trends Explorer: https://data.bto.org/trends_explorer
Historical climate data from the UK Met Office: https://www.metoffice.gov.uk/hadobs/hadcet/data/download.html
Climate change impact on biodiversity report cards: https://tinyurl.com/biodiversity-report-cards
TERMS EXPLAINED
Boreal The climatic zone to the south of the tundra, dominated by cold-adapted coniferous trees.
Habitat generalists/specialists Species differentiated by the number of habitats that they occupy, with specialists generally restricted to one or two habitat types, and generalists more widespread.
Oceanicity The influence of oceans upon climate. Oceanic climates are wetter, but have reduced seasonal temperature extremes compared with continental climates.
Topography The form of land features, including mountains, hills and coasts.
Treeline The elevational or latitudinal boundary beyond which trees are unable to grow.
Tundra The extensive treeless area of northern America, Europe and Asia, caused by low temperatures and permafrost.