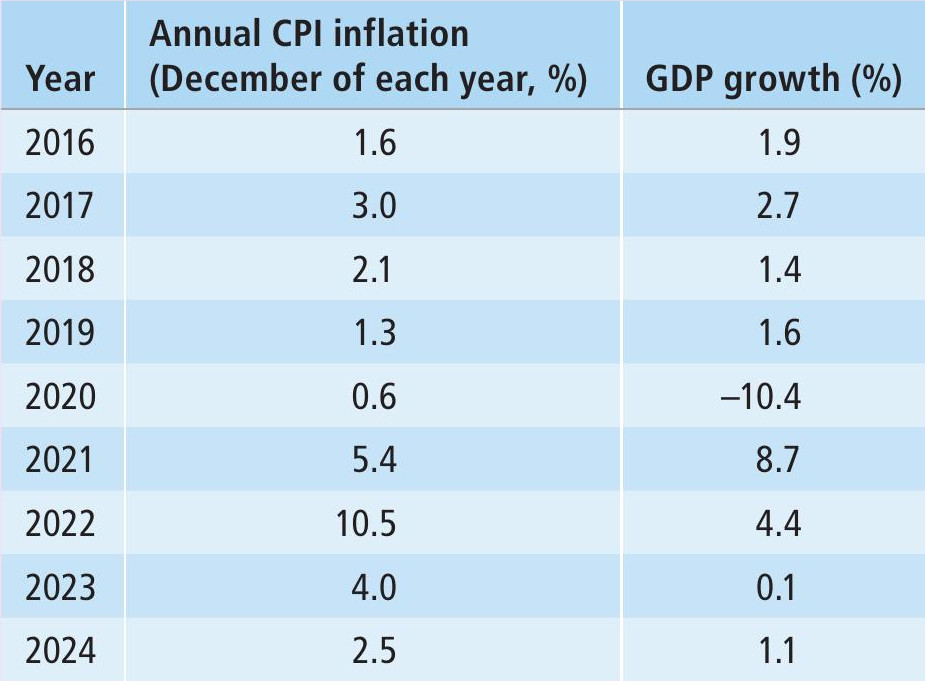
Table 1 UK CPI inflation and GDP growth rates, 2016–24
1 Using Table 1, calculate the mean average rate of GDP growth (%) in the UK from 2016 to 2024. Give your answer to one decimal place. (2 marks)
2 Explain how the data in Table 1 may show a positive relationship between GDP growth and inflation between 2016 and 2024. (4 marks)
Your organisation does not have access to this article.
Sign up today to give your students the edge they need to achieve their best grades with subject expertise
Subscribe