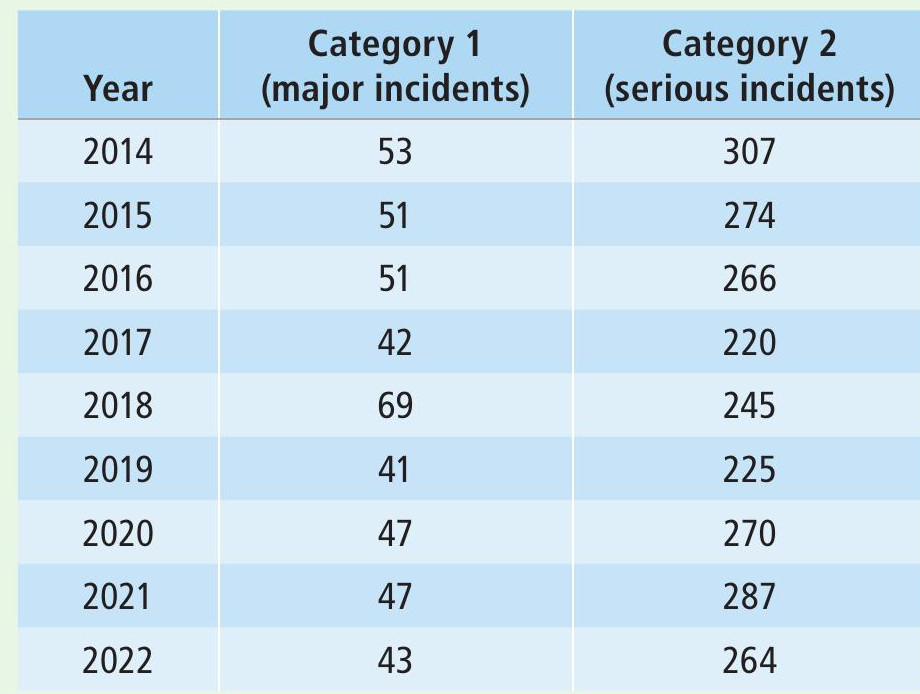
Table 1 Water pollution incidents in England, 2014–22
Source: Defra
1 Using Table 1, calculate the mean annual number of Category 1 (major) pollution incidents in England from 2014 to 2022. Give your answer to one decimal place. (2 marks)
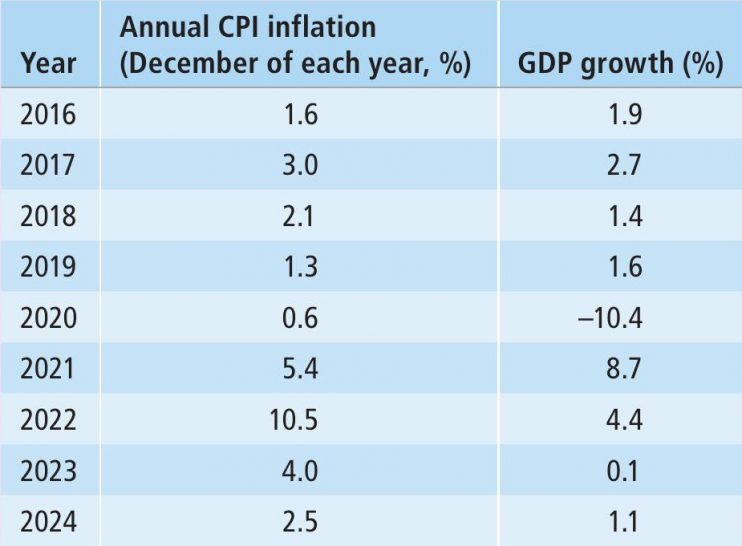
2 Explain how the data in Table 1 and Table 2 may show that the water industry is negatively affecting living standards in the UK. (4 marks)
Your organisation does not have access to this article.
Sign up today to give your students the edge they need to achieve their best grades with subject expertise
Subscribe